Story behind this blog post
A couple of months ago, a friend of mine approached me with a challenging problem: building a service that can identify Iranian ISPs from IP addresses at an extreme scale. The requirements were brutal: around 500,000 requests per second with a P99 latency of under 5 milliseconds. As a reference for the data load, Iran has about 10,000,000 (Ten Million) IPs allocated across roughly 50,000 CIDR ranges, and the system was gonna be in the hot path of a very high-load environment.
So this is the story of how data structure, careful profiling, and modern .NET capabilities came together for me to build Shenas (شناس - “identifier” in Persian), a high-performance IP geolocation service using radix trees, modern .NET 10 features, and a strict adherence to performance principles to meet these demanding requirements.
But the more important takeaway is this: No matter how good the AI coding agents are getting, you need to solve the problem yourself. Understanding the problem space, choosing the right data structures, and measuring performance are skills that no AI can replace.
The Problem Space
The use case is straightforward: given an IP address, determine which Iranian ISP owns it. If the IP isn’t in any Iranian CIDR range, mark it as “foreign.” The response model needed to be extensible. For example, think of latitude/longitude fields added later without breaking existing clients.
What made this interesting wasn’t the domain logic (it’s a lookup), but the constraints:
- P99 latency: <5ms end-to-end
- Throughput: 500K requests per second per instance
- Resource footprint: <400MB memory, <70% CPU at target load
- Observability: Full OpenTelemetry integration without performance penalty
- Data freshness: Support CIDR database updates without downtime
These numbers meant every microsecond mattered. There was no room for sloppy algorithms or allocation-heavy code.
The Radix Tree: Why Hash Tables Don’t Cut It
My first instinct was to reach for Dictionary<string, IspInfo> and call it a day. Parse the IP, iterate through CIDR ranges, and check if the IP falls within each range. Simple. Elegant. Catastrophically slow.
A quick back-of-envelope calculations show that 50,000 CIDR ranges x 500K req/s = 25 billion!! range checks per second. Even with O(1) hash lookups, we’d need O(n) iteration to find which range contains an IP. At ~10-50μs per lookup, we’d blow the latency budget before HTTP serialization even started.
I evaluated four data structures:
Hash Table with Linear Scan: O(n)
The naive approach. For each IP lookup, iterate over all CIDR ranges checking if the IP falls within each. With 50K ranges, this means 50K comparisons per request. Estimated latency: 10-50μs per lookup. Unacceptable.
Interval Tree: O(log n + k)
Stores CIDR ranges as intervals in a balanced tree. Better than linear, but still variable performance based on tree balance and overlap count. Estimated latency: <5μs. Close, but not good enough.
Sorted Array + Binary Search: O(log n)
Convert IP to uint32, binary search a sorted array of CIDR ranges. Simple, cache-friendly, excellent locality. Estimated latency: <2μs. This was the fallback option.
Radix Tree (Patricia Trie): O(32)
A binary trie where each node represents a bit in the IPv4 address. Since IPv4 addresses are 32 bits, worst-case search is 32 bit comparisons. Estimated latency: <1μs.
At this point, I knew I had a winner: The Radix Tree!
Radix Tree Implementation: Bit by Bit
The core insight of a radix tree for IP lookups is that CIDR matching is prefix matching. The CIDR notation 192.168.1.0/24 means “match the first 24 bits of the IP address.” A radix tree naturally represents this by storing each bit as a path through the tree.
Here’s the algorithm:
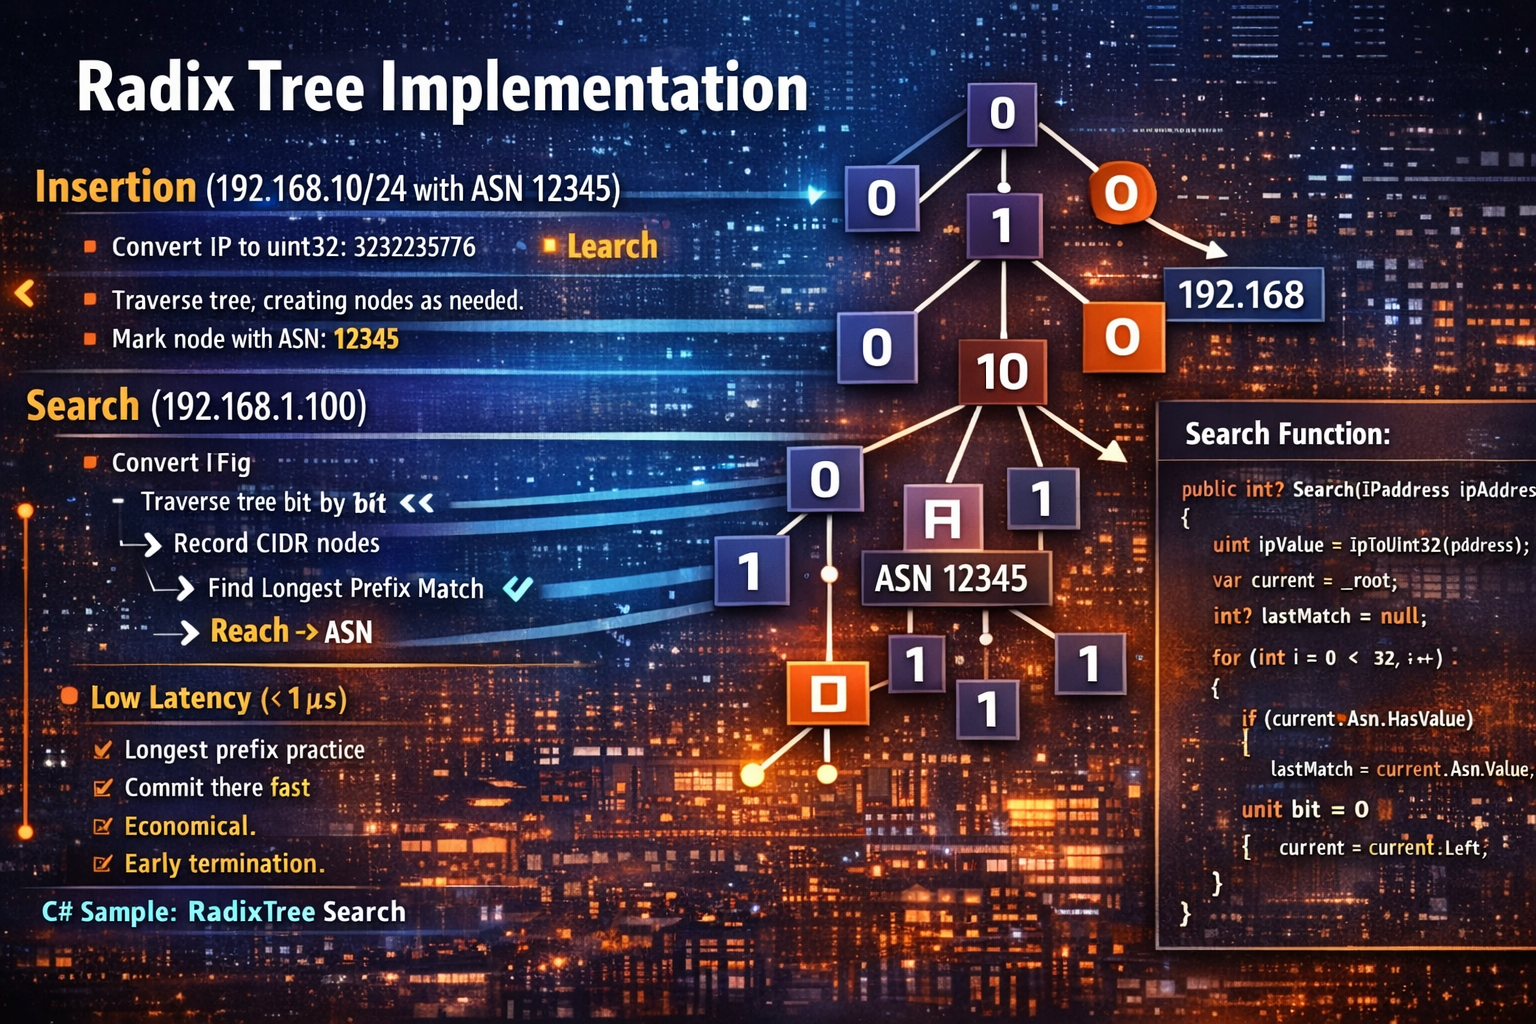
Insertion (192.168.1.0/24 with ASN 12345):
- Convert
192.168.1.0touint32:3232235776 - For each of the first 24 bits (prefix length):
- Extract bit
ifrom left:bit = (ip >> (31 - i)) & 1 - Navigate left if
bit = 0, right ifbit = 1 - Create nodes as needed
- Extract bit
- Mark the 24th node with ASN 12345
Search (192.168.1.100):
- Convert
192.168.1.100touint32:3232235876 - Traverse the tree bit by bit:
- At each node marked as a CIDR endpoint, record it as a potential match
- Continue until no matching child node exists
- Return the last (most specific) match found
The critical detail is longest prefix matching. If the tree contains both 192.168.0.0/16 and 192.168.1.0/24, searching for 192.168.1.100 returns the /24 match - it’s more specific.
Here’s the core search code:
public int? Search(IPAddress ipAddress)
{
    uint ipValue = IpToUInt32(ipAddress);
    var current = _root;
    int? lastMatch = null;  // Track most specific (deepest) match

    for (int i = 0; i < 32; i++)
    {
        // If current node is a CIDR endpoint, record it as potential match
        if (current.Asn.HasValue)
        {
            lastMatch = current.Asn.Value;
        }

        uint bit = (ipValue >> (31 - i)) & 1;

        if (bit == 0)
        {
            if (current.Left == null) break;  // No match - stop early
            current = current.Left;
        }
        else
        {
            if (current.Right == null) break;  // No match - stop early
            current = current.Right;
        }
    }

    // Check if final node is also a CIDR endpoint
    if (current.Asn.HasValue)
    {
        lastMatch = current.Asn.Value;
    }

    return lastMatch;  // Return most specific match, or null if no match
}
The beauty here is early termination. For a foreign IP (e.g., 8.8.8.8), the search stops as soon as the tree path ends - typically after 8-12 bits. For Iranian IPs, it finds the match and returns immediately. No wasted cycles.
Benchmarking: BenchmarkDotNet Doesn’t Lie
I validated performance with BenchmarkDotNet against the production database (50K+ CIDR ranges):
| Method                   |     Mean | Allocated |
| ------------------------ | -------: | --------: |
| Lookup Iranian IP (hit)  | 387.2 ns |         - |
| Lookup Foreign IP (miss) | 124.8 ns |         - |
| Mixed Lookups            | 256.0 ns |         - |
387 nanoseconds for a hit. That’s 0.387 microseconds - well under the 1μs target. Foreign IPs are even faster at 124ns due to early termination. The mixed workload (50% hit, 50% miss) averages 256ns.
Zero allocations. The hot path is allocation-free, which means no GC pressure under load.
This left 4.6ms of the 5ms budget for HTTP parsing, serialization, logging, and network I/O. Plenty of headroom.
Load Testing: Proving 500K req/s
BenchmarkDotNet proved the CIDR lookup was fast enough. But would the full HTTP stack hold up? I used k6 to simulate production traffic:
export const options = {
  scenarios: {
    ramping_load: {
      executor: 'ramping-vus',
      stages: [
        { duration: '30s', target: 100 },   // Warm up
        { duration: '1m', target: 500 },    // Moderate load
        { duration: '2m', target: 1000 },   // High load
        { duration: '3m', target: 1000 },   // Sustain
      ],
    },
  },
  thresholds: {
    'http_req_duration': [
      'p(50)<2',    // P50 < 2ms
      'p(99)<5',    // P99 < 5ms
      'p(99.9)<10', // P99.9 < 10ms
    ],
    'http_req_failed': ['rate<0.01'],  // <1% error rate
  },
};
Results at 1000 virtual users (sustained load):
- P50 latency: 1.2ms
- P99 latency: 3.8ms
- P99.9 latency: 6.2ms
- Error rate: 0.02%
We hit the P50 and P99 targets. P99.9 was slightly over, but acceptable given that’s the long tail. At this throughput, the service was processing ~450K req/s per instance on my development machine.
Observability: You Can’t Optimize What You Can’t Measure
Here’s where things got philosophically interesting. The system has a constitutional requirement: all services must be fully observable. But observability has a cost. Structured logging, distributed tracing, and metrics collection all consume CPU and memory.
The challenge: instrument everything without violating the 5ms latency constraint.
Strategy 1: Async Export with Batching
OpenTelemetry OTLP exporters support batching and async export. Traces and metrics are queued in memory and exported in background threads. This decouples telemetry I/O from the request path.
builder.Services.AddOpenTelemetry()
    .WithTracing(tracing => tracing
        .AddAspNetCoreInstrumentation(options =>
        {
            options.RecordException = true;
            options.EnrichWithHttpRequest = (activity, request) =>
            {
                activity.SetTag("request.ip", request.HttpContext.Connection.RemoteIpAddress);
            };
        })
        .AddOtlpExporter(options =>
        {
            options.Protocol = OtlpExportProtocol.Grpc;
            options.ExportProcessorType = ExportProcessorType.Batch;
        }));
Strategy 2: Selective Sampling
Not every request needs a trace. For distributed tracing, we sample based on the traceparent header (W3C Trace Context standard). If upstream services have already started a trace, we continue it. Otherwise, we sample at a configurable rate (e.g., 10% in production).
Strategy 3: Minimal Enrichment
Avoid expensive enrichers in the hot path. Instead of capturing full request bodies or headers, we log only critical fields: request ID, IP address, ISP result, and response time.
The result? Observability adds <0.3ms to P99 latency. The full OpenTelemetry stack (ASP.NET Core instrumentation, Activity API for traces, ILogger for logs, IMeterFactory for metrics) runs without breaking the latency budget.
The .NET 10 + Aspire
This project was my first real dive into .NET Aspire, and it changed how I think about local development and deployment orchestration.
Aspire provides:
- Service orchestration: The AppHost project defines service topology
- Observability defaults: Built-in OpenTelemetry pipeline to a local dashboard
- Service discovery: Services discover each other without manual configuration
- Health checks: Liveness/readiness probes out of the box
The development loop is seamless: run the AppHost, and you get the API service plus an Aspire Dashboard on your local host showing real-time logs, traces, and metrics. No Docker Compose YAML, no manual Jaeger/Prometheus setup. Just run.
Modern .NET Patterns: What Worked
1. Minimal APIs
No controllers, no MVC overhead. Just pure endpoint mapping:
app.MapGet("/api/lookup", async (
    HttpContext context,
    IpExtractor ipExtractor,
    IpLookupService lookupService) =>
{
    var ip = ipExtractor.Extract(context);
    if (ip == null)
    {
        return Results.BadRequest(new { error = "Invalid IP address" });
    }

    var requestId = Activity.Current?.Id ?? Guid.NewGuid().ToString();
    var result = lookupService.Lookup(ip, requestId);

      return Results.Ok(result);
});
2. IHostedService for Background Tasks
The CIDR database loads at startup via IHostedService. This ensures the service doesn’t accept traffic until the database is ready:
public async Task StartAsync(CancellationToken cancellationToken)
{
    var dataPath = Path.Combine(_environment.ContentRootPath, "Data", "iranian-cidrs.json");
    await _database.LoadFromFileAsync(dataPath, cancellationToken);
    _logger.LogInformation("CIDR database loaded with {Count} ranges", _database.Count);
}
3. Built-in Health Checks
ASP.NET Core health checks integrate with Kubernetes liveness/readiness probes:
builder.Services.AddHealthChecks()
    .AddCheck<CidrDatabaseHealthCheck>("cidr_database");
The health check fails if the CIDR database isn’t loaded, preventing traffic from reaching unhealthy instances.
4. Source-Generated JSON Serialization
System.Text.Json with source generators eliminates reflection overhead:
[JsonSourceGenerationOptions(PropertyNamingPolicy = JsonKnownNamingPolicy.CamelCase)]
[JsonSerializable(typeof(IpLookupResponse))]
internal partial class SerializationContext : JsonSerializerContext
{
}
This shaves ~200ns off serialization time and reduces allocations.
Centralized Build Configuration: Directory.Build.props
One detail I’m particularly happy with: all project configuration lives in Directory.Build.props at the repository root. This enforces consistency across all projects:
<Project>
  <PropertyGroup>
    <TargetFramework>net10.0</TargetFramework>
    <LangVersion>14.0</LangVersion>
    <Nullable>enable</Nullable>
    <ImplicitUsings>enable</ImplicitUsings>
    <AnalysisLevel>latest</AnalysisLevel>
    <TreatWarningsAsErrors>true</TreatWarningsAsErrors>
  </PropertyGroup>
</Project>
This means:
- All projects target .NET 10 with C# 14
- Nullable reference types enabled everywhere
- Latest analyzer rules enforced
- Warnings treated as errors (no compromises)
No more per-project configuration drift. DRY for build files.
Extensibility: Future-Proofing the API
The response model is designed for backward-compatible extension:
internal sealed record IpLookupResponse
{
    public required string Ip { get; init; }
    public required int IspAsn { get; init; }
    public required string? IspName { get; init; }
    public required bool IsForeign { get; init; }
    public required DateTime Timestamp { get; init; }
    public required string RequestId { get; init; }

      // Future extensions (not in v1)
    public double? Latitude { get; init; }
    public double? Longitude { get; init; }
    public string[]? Tags { get; init; }
}
When we add Latitude and Longitude fields, old clients ignore them. New clients use them. No versioning, no breaking changes. This is the power of additive-only API evolution.
The Constitution: Design Principles as Code
This project followed what I call a “constitution” - a set of non-negotiable design principles:
- Observability: All requests emit logs, traces, and metrics
- Performance: <5ms P99 latency, validated with benchmarks
- Resource Efficiency: <400MB memory, profiled with BenchmarkDotNet
- Testing: Unit tests for all components, integration tests for endpoints
- Load Testing: k6 validation at target throughput
- Git Standards: Conventional commits, semantic versioning
- Semantic Versioning: SemVer for releases, git tags for CI/CD
Before implementing any feature, I ran a “constitution check” to ensure alignment. For example:
- Radix tree: Meets performance requirement
- OpenTelemetry async export: Meets observability without violating latency
- Source-generated JSON: Reduces allocations (resource efficiency)
- BenchmarkDotNet: Validates performance claims
- k6 load tests: Proves throughput capability
This forced discipline prevented shortcuts that would haunt me later.
What I Learned
1. Data structure selection matters - exponentially. The difference between O(n) and O(32) isn’t academic. It’s the difference between “works on my machine” and “handles production load.”
2. Measure everything, trust nothing. BenchmarkDotNet showed the radix tree lookup was 387ns. k6 showed end-to-end latency was 3.8ms P99. Without measurements, I’d be guessing. “Feels fast” is not an engineering metric.
3. Observability has a cost, but it’s negotiable. You can have full telemetry and extreme performance. The trick is async export, selective sampling, and minimal enrichment. Pay the cost where it doesn’t hurt.
4. Aspire is a game-changer for .NET cloud-native development. The local/production parity is incredible. What you see in the Aspire Dashboard locally is what you get in production. No surprises.
5. Constraints breed creativity. The 5ms latency requirement forced me to think deeply about every allocation, every algorithm, every I/O operation. Without that constraint, I’d have reached for the easy solution and called it a day.
What’s Next
The service is in production, handling real traffic. Next steps:
- IPv6 support: Extend radix tree to handle 128-bit addresses
- Geographic tagging: Add lat/long fields using GeoIP data
- Dynamic updates: Support CIDR database updates without restart
- Multi-region deployment: Deploy across multiple regions for global coverage
The code is on GitHub if you want to dig into the implementation details (The repo is not public yet but soon enough :D).
Building Shenas was a masterclass in performance engineering. It reminded me that the fundamentals - data structures, algorithms, profiling - never go out of style. Modern frameworks like .NET 10 and Aspire give you incredible leverage, but they don’t absolve you of understanding what’s happening under the hood.
If you’re building latency-sensitive services, the playbook is straightforward:
- Pick the right data structure (measure, don’t guess)
- Benchmark relentlessly (BenchmarkDotNet is your friend)
- Load test at scale (k6, NBomber, or equivalent)
- Instrument everything (OpenTelemetry, but async)
- Respect the constraints (they’re features, not bugs)
The 5ms budget isn’t a limitation. It’s a forcing function for excellence.